Tuesday, 14 October 2014

Crash or Correction? See What Key US Economic Data Are Indicating!

For the past 5 days (8th Oct 2014 - 13th Oct 2014), the Dow Jones Index have shed 429.34 points (-2.52%). There's raising concern that there will be further correction of the Index as investors continue to let go of their stock holdings. 

Is this the time for us the local Malaysian Investors to exit our holdings as well? Or perhaps this is a correction that creates opportunities for us to buy stocks or unit trust at low prices?


Dow Jones Crashing or Correcting?

Technical analysis aside, let us take a look at the current US Economic Data to see if we are infact facing crash or a correction? 

Economic Data:
1) US Purchasing Managers Index
  • Benchmark : Value above 50.00 indicate positive manufacturing growth
  • US PMI data as of 30 Sept 2014 : 56.60
  • US PMI data as of 31 July 2013 : 55.40 (previous review)
  • Additional Information : The PMI data for 30th of September 2014 increased by 1.20 (+2.17%) in comparison to PMI data of 55.40 recorded on 31st of July 2013
  • Current Outlook : POSITIVE

What is PMI? Click HERE to find out.


2) US Unemployment Rate
  • Benchmark : 
    • Highest Unemployment Rate Recorded over 10 years : 10% in Oct 2009
    • Lowest Unemployment Rate Recorded over 10 years : 4.4% in May 2007
    • 2008 Global Financial Crisis was forewarned when Unemployment Rate spiked from 5.0% in April 2008 to 5.4% in May 2008
  • Unemployment Rate for Sept 2014 : 5.9%
  • Unemployment Rate for July 2013 : 7.4% (previous review)
  • Additional Information : Currently the Unemployment rate is still at reducing trend. Investors to be wary when the Unemployment Rate touches the 5.0% and below range. Also to watch out for sudden increase of unemployment rate when the figures are at 5.0% and below.
  • Current Outlook : POSITIVE

More about Unemployment Rate? Click HERE.


3) US Treasuries Yield Curve
  • Benchmark :
    • Positive Yield Curve indicate economic recovery
    • Flat Yield Curve indicate slow economic growth
    • Negative Yield Curve indicate impending economic recession
  • US Treasuries Yield Curve as of 10th Oct 2014 : Positive Yield Curve with Low Interest Rate
  • US Treasuries Yield Curve as of 31st July 2013 : Positive Yield Curve with Low Interest Rate (previous review)
  • Current Outlook : POSITIVE

More about Yield Curve? Click HERE.


SUMMARY
All three (3) main economic data from the United States are indicating a positive outlook at the present moment. However, investors should watch closely the unemployment data as it is close to approaching the critical value of 5%. 

In my honest opinion, the Dow Jones is currently undergoing a correction and not a crash. Economic data are indicating that the fundamentals of growth in the US are still strong.

Disclaimer : I must stress that what I;ve to posted above are purely economic data. It is not a recommendation to buy or sell. The choice is ultimately yours to decide.

P.s : If you are looking for a passive long term investment via online, feel free to contact me at shanesee03@gmail.com

If you like reading this post, it would do me a great favor by:
1. Sharing this post on your Facebook!
2. Liking my Facebook Page


Moving Away from Traditional Way of Financial Planning?

This simple pictures really does paint a thousand words. Is it time for us to reevaluate our financial goals to what we desire or do we still stick to the key important goals such as obtaining a home to live in, sufficient fund for retirement and for children education?

A New Approach to Financial Planning?

Sunday, 21 September 2014

Top 10 Best Performing Unit Trust Funds As of 12th September 2014

Interesting facts in this review:
  1. For the fourth consecutive month, Greater China Funds have posted positive average returns. Total average returns over the past 4 months for for Greater China Funds stands at 7.70%!
  2. Find out which fund under Equity Malaysia has occupied the number One Ranking under the "4 Weeks Gain/Loss Ranking" for 3 consecutive months!
  3. Find out which fund has managed to gain an astounding 19.94% since 1st January 2014!
  4. Find out funds from Eastspring Investments that have managed to break through the Top 10 under Equity Malaysia category.
To find out all the above, check out this months review of the Top 10 Best Performing Unit Trust Funds As of 14 August 2014.

Note : If this is your first time reading this review, I would highly recommend that you read "A Guide Towards Understanding Unit Trust Performance Table" before proceeding. Seriously you should! 

Review

Fund Category : Equity Malaysia
a) Top 10 Best Performing Fund for Category Equity Malaysia (Ranked According to 5 Year Annualized Return):


Top Performer based on 5 Year Performance

5 Years Annualised Ranked 1 (Non-Islamic) 
Kenanga Growth Fund (+23.53% per annum)

5 Years Annualised Ranked 1 (Islamic Equity) 
- Kenanga Syariah Growth Fund (+18.55% per annum)

Top Performer based on Yield To Date (YTD) Performance

YTD Ranked 1 (Non-Islamic) 
Kenanga Growth Fund (YTD : +19.94%)

YTD Ranked 1 (Islamic) 
Eastspring Investments Dana Al-Ilham (YTD : +12.62%)


b) 4 Weeks Gain/Loss Ranking Table for Category Equity Malaysia Funds:

Fund Name
YTD as of
14th Aug 2014
YTD as of
12th Sept 2014
4 Weeks
Gain / Loss (%)
4 Weeks Gain/
Loss Rankings
Previous
4 Weeks Gain/Loss Rankings
Kenanga Growth Fund
19.15
19.94
0.79
1
1
Phillip Master Equity Growth Fund
9.36
9.61
0.25
2
3
Kenanga Syariah Growth Fund
8.51
8.14
-0.37
4
7
CIMB-Principal Wholesale Equity Fund
12.52
12.45
-0.07
3
2
MAAKL-HDBS Flexi Fund
6.5
5.16
-1.34
6
8
Areca Equity Trust Fund
Newcomer
18.21
N/A
N/A
N/A
Eastspring Investments Equity Income Fund
Newcomer
9.55
N/A
N/A
N/A
Eastspring Investments Dana Al-Ilham
Newcomer
12.62
N/A
N/A
N/A
RHB-OSK Malaysia DIVA Fund
6.81
6.08
-0.73
5
5
Kenanga Growth Opportunities Fund
15.3
12.82
-2.48
7
9
AVERAGE 4 WEEKS GAIN/LOSS (%)
-0.56

Best Performing Fund over 4 weeks period: 
  • Non Syariah : Kenanga Growth Fund (+0.79%)
          *Kenanga Growth Fund has occupied the number One Ranking under the "4 Weeks Gain/Loss Ranking" for 3 consecutive months!
  • Syariah : Kenanga Syariah Growth Fund (-0.37%)

Worst Performing Fund 4 weeks period:
  • Non Syariah : Kenanga Growth Opportunities (-2.48%)
          *Kenanga Growth Opportunities has lost 4.5% over the past 2 months. 
  • Syariah : MAAKL-HDBS Flexi Fund (-1.34%)
          *MAAKL-HDBS Flexi Fund has lost 2.71% over the past 2 months.


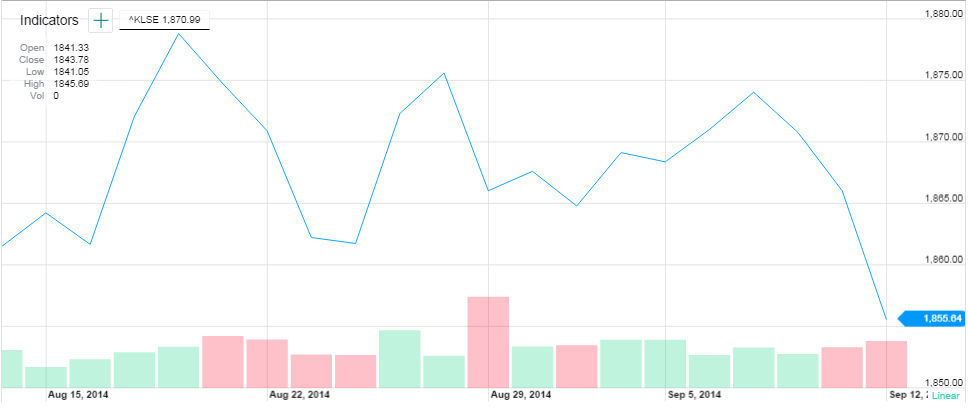
c) Performance Comparison with the KLSE Index between 14 Aug 2014 to 12 Sept 2014


KLSE Index (%) Gain/Loss : -0.32%

Comparison With:
  • Average Top 10 Unit Trust Equity (%) Gain/Loss : -0.56% (Under performed the KLSE Index)
  • Non Syariah - Kenanga Growth Fund : +0.79% (Out performed the KLSE Index)
  • Syariah - Kenanga Syariah Growth Fund : -0.37% (Under performed the KLSE Index)

Review

Fund Category : Asia excluding Japan
a) Top 10 Best Performing Fund for Category Asia Exc Japan 
(Ranked According to 5 Year Annualized Return):


Top Performer based on 5 Year Performance

5 Years Annualised Ranked 1 (Non-Islamic) 
Eastspring Investments Asia Pacific Equity MY Fund (+4.09% per annum)

5 Years Annualised Ranked 1 (Islamic Equity) 
- Public Islamic Asia Dividend Fund (+7.28% per annum)

Top Performer based on Yield To Date (YTD) Performance

YTD Ranked 1 (Non-Islamic) 
Eastspring Investments Asia Pacific Equity MY Fund (YTD : +9.78%)

YTD Ranked 1 (Islamic) 
Pheim Asia Ex-Japan Islamic Fund (YTD : +9.97%)


b) 4 Weeks Gain/Loss Ranking Table for Category Asia Exc Japan Funds:

Fund Name
YTD as of
14th Aug 2014
YTD as of
12th Sept 2014
4 Weeks
Gain / Loss (%)
4 Weeks Gain/
Loss Rankings
Previous
4 Weeks Gain/Loss Rankings
Public Islamic Asia Dividend Fund
3.19
1.77
-1.42
5
5
Pheim Asia Ex-Japan Islamic
12.02
9.97
-2.05
9
1
Public Asia Ittikal Fund
2.96
1.46
-1.5
6
3
Eastspring Investments Asia Pacific Equity MY Fund
9.51
9.78
0.27
1
2
PB Islamic Asia Equity Fund
4.44
2.52
-1.92
8
4
Hwang Select Asia (Ex Japan) Opportunity Fund
7.64
5.8
-1.84
7
7
PB Islamic Asia Strategic Sector Fund
3.89
2.77
-1.12
3
6
Eastspring Investments Asia Pacific Shariah Equity Fund
-0.8
-1.98
-1.18
4
8
AmCumulative Growth
Returning
0.51
N/A
N/A
N/A
Hong Leong Asia-Pacific Dividend Fund
5.23
4.8
-0.43
2
N/A
AVERAGE 4 WEEKS GAIN/LOSS (%)
-1.24

Best Performing Fund over 4 weeks period: 
  • Non Syariah : Eastspring Investments Asia Pacific Equity MY Fund (+0.27%)
  • Syariah : PB Islamic Asia Strategic Sector Fund (-1.12%)
Worst Performing Fund over 4 weeks period:
  • Non Syariah :  Hwang Select Asia (Ex Japan) Opportunity Fund (-1.84%)
  • Syariah : Public Asia Ex-Japan Islamic (-2.05%)

c) Performance Comparison with the MSCI Asia Excluding Japan Index between 14 Aug 2014 to 12 Sept 2014


MSCI Asia Exc Japan Index (%) Gain/Loss : -0.84%

Comparison With:
  • Average Top 10 Unit Trust (%) Gain/Loss : -1.24% (Under performed the MSCI Index)
  • Non Syariah - Eastspring Investments Asia Pacific Equity MY Fund : +0.27% (Out performed the MSCI Index)
  • Syariah - PB Islamic Asia Strategic Sector Fund : -1.12% (Under performed the MSCI Index)


Review

Fund Category : Greater China
Top 10 Best Performing Fund for Category Greater China 
(Ranked According to 5 Year Annualized Return):


Top Performer based on 5 Year Performance

5 Years Annualised Ranked 1 (Non-Islamic) 
CIMB-Principal Greater China Equity Fund (+4.10% per annum)

5 Years Annualised Ranked 1 (Islamic Equity) 
- Public China Ittikal Fund (+1.11% per annum)

Top Performer based on Yield To Date (YTD) Performance

YTD Ranked 1 (Non-Islamic) 
CIMB-Principal Greater China Equity Fund (YTD : +7.04%)

YTD Ranked 1 (Islamic) 
Public China Ittikal Fund (YTD : +6.91%)


b) 4 Weeks Gain/Loss Ranking Table for Category Greater China Funds:

Fund Name
YTD as of
14th Aug 2014
YTD as of
12th Sept 2014
4 Weeks
Gain / Loss (%)
4 Weeks Gain/
Loss Rankings
Previous
4 Weeks Gain/Loss Rankings
CIMB-Principal Greater China Equity Fund
5.31
7.04
1.73
2
9
Pacific Focus China Fund
4.47
4.65
0.18
6
5
Public China Ittikal Fund
7.51
6.91
-0.6
9
10
PB China Pacific Equity Fund
3.35
3.97
0.62
4
1
PB China Titans Fund
4.46
4
-0.46
7
2
Public China Select Fund
4.32
4.66
0.34
5
4
MAAKL Greater China Fund
0.84
0.35
-0.49
8
6
AmIslamic Greater China
-0.64
0.8
1.44
3
8
Eastspring Investments Dinasti Equity Fund
1.56
0.37
-1.19
10
7
Manulife Investment - China Value Fund
1.19
3.61
2.42
1
3
AVERAGE 4 WEEKS GAIN/LOSS (%)
0.40

Best Performing Fund over 4 weeks period: 
  • Non Syariah : Manulife Investment - China Value Fund (+2.42%)
  • Syariah : AmIslamic Greater China (+1.44%)
Worst Performing Fund over 4 weeks period:
  • Non Syariah :  MAAKL Greater China Fund (-0.49%)
  • Syariah : Eastspring Investments Dinasti Equity Fund (-1.19%)


c) Performance Comparison with the Shanghai Stock Exchange (SSE) Index between 14 Aug 2014 to 12 Sept 2014


SSE Index (%) Gain/Loss : +4.91%

Comparison With:
  • Average Top 10 Unit Trust Equity (%) Gain/Loss : +0.40% (Under performed the SSE Index)
  • Non Syariah - Manulife Investment - China Value Fund +2.42% (Under performed the SSE Index)
  • Syariah -  AmIslamic Greater China : +1.44(Under performed the SSE Index)

*******************
That's all for this review folks!

Cheers and Happy Investing!

Like to Invest in Top Performing Funds such as
1. Kenanga Growth Fund
2. Kenanga Syariah Growth Fund
3. Eastspring Dana-Al Ilham

and also invest at a Lower Sales Charge of 2%?


Then feel free to contact shanesee03@gmail.com for further questions and advice!