Showing posts with label EPF. Show all posts

Friday, 6 December 2013

EPF Posts RM10.11 Billion Investment Income For Q3 2013 - Q3 2013 Income Up 44%

Taken from KWSP Website:

The Employees Provident Fund (EPF) generated investment income of RM10.11 billion for the third quarter ending 30 September 2013 (Q3 2013), representing a healthy year-on-year growth of 44.00% compared with RM7.02 billion investment income generated in the corresponding quarter in 2012.

In a statement issued today on its unaudited investment results for the third quarter of 2013 (Q3 2013), EPF Chief Executive Officer Datuk Shahril Ridza Ridzuan said, “The performance is primarily driven by a more robust equity market on both domestic and foreign fronts, coupled with a significant rise in trading volume in the third quarter. We have also benefited from higher dividend payouts from listed companies due to improved earnings.”

Equities continued to generate a higher proportion of investment income in Q3 2013 amounting to RM5.71 billion or an increase of RM3.37 billion compared with RM2.34 billion recorded in the corresponding period in 2012. Meanwhile, investment income derived from Real Estate and Infrastructure assets surged from RM54.62 million in Q3 2012 to RM429.16 million in Q3 2013, continuing the growth in performance since Q1 2013. 

The higher income from Equities helped offset a fall in income from Loans and Bonds, which was lower at RM2.28 billion compared with RM3.06 billion in the Q3 2012. This was reflective of the overall fall in yields for maturing assets that were reinvested. The higher Q3 2012 income was also due to one-off capital market transactions which were not repeated in Q3 2013. 

Malaysian Government Securities and Equivalents in Q3 2013 posted RM1.55 billion in income, reflecting a nominal increase of 0.18 per cent compared with Q3 2012 while Money Market Instruments contributed RM145.23 million for Q3 2013 income.

“The EPF continues to diversify its investments across markets, sectors and asset classes to provide optimal sustainable returns in the long term. Our global investments offer stable returns on a long-term basis, befitting our risk-return appetite as a retirement fund. We are also able to find opportunities from, and reduce the risk of, asymmetric market movements, such as the improvement in global developed economies and the selldown in emerging market currencies,” Datuk Shahril said.

As at Q3 2013, the EPF’s total overseas exposure constituted 20.39 per cent of its total investment assets based on book value, registering a rise from 18.97 per cent in Q2 2013. During the quarter under review, an additional USD2.50 billion of overseas investments were made and of the total, USD2.25 billion had been channelled into global equity mandates and the balance invested in global bonds, infrastructure and private equities. 

During the same quarter, the EPF also outsourced a further RM1 billion for domestic fixed income mandates.

Datuk Shahril added, “Currently, more than one third of EPF’s total investment assets are shariah compliant. The growth in Islamic finance assets globally presents us with the opportunity to further expand our investments into this space. This is also in line with the Fund’s diversification programme to continuously rebalance our portfolios according to our risk-return profile.

“Our efforts in shaping the Islamic finance industry have led us to be awarded the Best Institutional Solutions Provider in the Islamic Finance News (IFN) Islamic Investor Poll 2013. This is the second year in a row that EPF has received a major award in the Islamic Finance space.”

As at 30 September 2013, EPF’s investment assets increased by RM57.85 billion to RM568.04 billion from RM510.19 billion in Q3 2012. Total contributions of RM12.76 billion received in Q3 2013 exceeded the total amount withdrawn of RM8.85 billion, resulting in RM3.91 billion net inflows of funds for the quarter under review.

On the global economic outlook, Datuk Shahril said, “Even though we see signs of the global economy gradually improving, we remain concerned that the recovery is fragile, given ongoing policy and economic risks in the United States, Europe and China. The recently announced Budget 2014 is positive for the Malaysian economy and fiscal position as it clearly sets the agenda to restructure taxes and subsidies for long-term structural benefits and competitiveness. The EPF will continue with its policy of targeting real returns via prudent asset allocation and investment strategies.”

Sunday, 17 February 2013

EPF Announces 2012 Dividend Payout!

Although it is expected that the actual announcement to be somewhere next week, EPF decided to spring a surprise by picking today (which also coincides with the first day of Chinese New Year for Hokkiens) to make an announcement. In a press release dated 17th February 2013 taken from EPF's website, I hereby summarized the details of the announcement:

1. Historical EPF Dividend Rates vs Fixed Deposit (12 months) & Inflation (FDI):

2. Amount Needed to Pay Each 1% Dividend Rate:

3. EPF Investment Asset Growth in 2012 and 2011:

4. EPF Gross Investment Income in 2012 and 2011


5. Total EPF Gross Investment Income for 2012 : RM 31.02 billion
6. Total Dividend Payout : RM 27.45 billion

Actual % Dividend Payout : 
6.15%

Other Details from the Announcement

Members may check their EPF Account Statement for the crediting of the 2012 dividend, either through EPF Kiosks, counters or  i-Akaun, from Monday, 18 February 2013.
Members age 55 and above may withdraw the annual dividend credited into their account as one of several payment options available under the Age 55 Withdrawal. For more information on this withdrawal, please contact EPF Call Centre at 03 – 8922 6000 from 8.00 am to 7.00 pm from Monday to Friday or log on to myEPF atwww.kwsp.gov.my
Predicted EPF Payout
In an older post titled "EPF Dividend, Big or Small 'Ang Pow'", I tried to predict the Dividend Payout for EPF 2012 as shown below:

Total EPF Gross Investment Income : RM 29.70 billion
Predicted % Dividend Payout : 6.12%

Difference between the real dividend payout vs predicted dividend payout : 0.03%

Not too bad for an amateur prediction! (grin)

Cheers and Happy Investing!

Give me an ang pow for writing this post by :
1. Sharing it on your Facebook!
3. Subscribing to me. See the "FOLLOW MY ARTICLES VIA EMAIL" section located at the top left? Just key in your email and click Submit.
4. Visit my blog for other articles at http://invest-made-easy.blogspot.com/

Saturday, 2 February 2013

EPF Dividend for 2012, Big or Small "Ang Pow"?

Apart from looking forward to the Chinese New Year festivities, the month of February is also a month where we anticipate the announcement of 2012 EPF Dividend!

For the record, the 2010 EPF dividend distribution was declared on 21st of Feb 2011 while 2011 dividend distribution was declared on 19th of Feb 2012. Therefore, it is highly likely that 2012 EPF dividend distribution announcement should also fall between those dates.

For income earners, people who we say "makan gaji", they tend to place some importance in knowing the EPF dividend payout. The higher the dividend declaration, the more money for retirement!

Now, to give a speculated projected prediction, we first take a look at EPF's performance for 2010, 2011 and 2012:

EPF’s GROSS INVESTMENT INCOME

2010
(RM, billion)
2011
(RM, billion)
2012
(RM, billion)
Quarter 1
5.55
6.53
7.74
Quarter 2
5.93
6.75
7.66
Quarter 3
5.75
6.80
7.02
Quarter 4
6.83
7.16
Total
24.06
27.24
?

Predicting Quarter 4 and Total performance of EPF for 2012
Based on the previous table, we can establish a relative percentage income growth between 2010 with 2011 and 2011 with 2012 as shown below:


2010
(RM, billion)
2011
(RM, billion)
% increase 2010 to 2011
2012
(RM, billion)
% increase
2011 to 2012
Quarter 1
5.55
6.53
+17.66%
7.74
+18.53%
Quarter 2
5.93
6.75
+13.83%
7.66
+13.48%
Quarter 3
5.75
6.80
+18.26%
7.02
+3.24%
Quarter 4
6.83
7.16
+4.83%
?
?
Total
24.06
27.24
13.21%
?
?

Key Observation
  1. For Quarter 1 and Quarter 2, the % increase of income have been consistent for the past 2 years. 
  2. For Quarter 3, the income growth between 2010-2011 is 18.26%, yet between 2011-2012 the growth is only 3.24%. The difficulty in bringing consistent high returns was mentioned by Tan Sri Azlan Zainol, CEO of EPF during the 2012 Quarter 3 announcement. 
Quote: "Given the continuing uncertainty in the economy and the low interest rate environment, it will be tough to sustain current investment performance in the quarters to come. Nonetheless, the EPF continues to maintain a robust risk management framework with tactical investment strategies in place to ensure that it does not only preserve, but also enhance the value of members' retirement funds," 


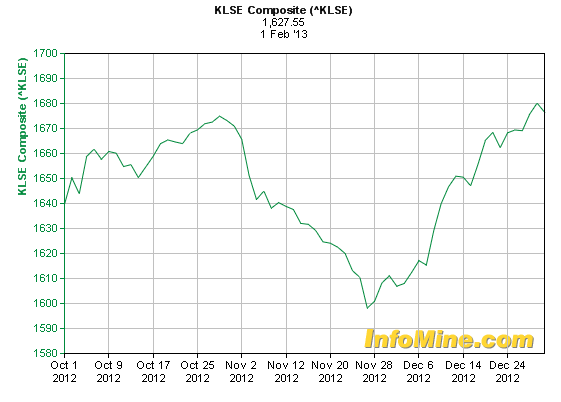
It is expected that the performance of Quarter 4, 2012 would largely be determined by the performance of the Kuala Lumpur Stock Exchange (KLSE). 

Thanks to this SITE, I was able to obtain obtain the performance of our Kuala Lumpur Stock Exchange Index for Quarter 3 (2012) and Quarter 4 (2012):

Chart for Quater 3
For Quarter 3 (2012), the KLSE Index gained 2.12%

Chart for Quarter 4
For Quarter 4 (2012), the KLSE Index gained 2.20% 

Quarter to Quarter Gain from KLSE Index:
= (Quarter 4 Gain - Quarter 3 Gain) / Quarter 3 Gain x 100%
= (2.20% - 2.12%) / 2.12% x 100% 
+3.77%

Next is to use the 3.77% Quarter to Quarter gain from KLSE Index to project Quarter 4 EPF income earnings. 

Projected Quarter 4 EPF Income:
= EPF's Quarter 3 Earnings x (100% + 3.77%)
= RM 7.02 billion x 1.0377
= RM 7.28 billion

Total EPF's income earnings:
= Q1 + Q2 + Q3 + Q4
= RM 29.7 billion

The updated table based on the projected calculation for Q4 and Total EPF Earnings as shown below:


2010
(RM, billion)
2011
(RM, billion)
% increase 2010 to 2011
2012
(RM, billion)
% increase
2011 to 2012
Quarter 1
5.55
6.53
+17.66%
7.74
+18.53%
Quarter 2
5.93
6.75
+13.83%
7.66
+13.48%
Quarter 3
5.75
6.80
+18.26%
7.02
+3.24%
Quarter 4
6.83
7.16
+4.83%
7.28*
+1.68%*
Total
24.06
27.24
+13.21%
29.70*
+9.03%*
*projected figures and percentages

How much Dividend will EPF announce for 2012?
This is another table that shows the correlation between past EPF income earnings with dividend payout:


EPF Gross Investment Income
(RM, billion)
Dividend Payout
2009
19.63
5.65 %
2010
24.07
5.80 %
2011
27.24
6.00 %
2012
29.70*
X
*projected figures and percentages

Key Observations
  1. Between 2009 to 2010, EPF's Gross Investment Income added RM4.44 billion and dividend payout was increased by +0.15%. That's 0.034% dividend increase for every 1 billion added.
  2. Between 2010 to 2011, EPF's Gross Investment Income added RM3.17 billion and dividend payout was increased by +0.20%. That's 0.063% dividend increase for every 1 billion added
  3. It is projected that between 2011 to 2012, EPF's Gross Investment Income will add RM2.46 billion.
I know there are a many other factors that need to be considered to make an accurate prediction,  but I'll leave that to the experts. 

To make things simple, I intend to take the average for "dividend increase/billion gained" as stated in Item 1 and 2 and use that value to project the dividend for 2012. Here's the calculation:

Average Dividend Increase per billion gained :
= (0.034% per billion gained + 0.063% per billion gained) / 2
= 0.0485 % per billion gained

Projected EPF Dividend increase for 2012 :
= (0.0485 % per billion gained) x (RM2.46 billion gained for 2012)
= 0.12%

Projected EPF Dividend for 2012:
= (2011 Dividend) + (Projected EPF Dividend increase for 2012)
= 6.00% + 0.12%
= 6.12%

Summary
I know that there are many assumptions in my prediction and I am expecting this post to get quite a bit of bashing from experienced readers. Well what's most important after writing this post is that I got to know EPF just a little bit better. 

If EPF is able to return a dividend close to what I've calculated, that's small ang pow for me. Anything more, then it's considered a big ang pow. Fingers crossed!

Cheers and Happy Investing!

Give me an ang pow for writing this post by :
1. Sharing it on your Facebook!
3. Subscribing to me. See the "FOLLOW MY ARTICLES VIA EMAIL" section located at the top left? Just key in your email and click Submit.
4. Visit my blog for other articles at http://invest-made-easy.blogspot.com/

Monday, 14 January 2013

Private Retirement Scheme (PRS), Enjoying The Benefits of Tax Relief - Part 3

The major selling point of the PRS is non other then the RM3,000 tax relief given. For investors who are have invested into PRS funds, they are eligible to a maximum of RM3,000 tax relief per year. Due to that reason alone, many investors have rushed to make the cut off date for PRS submission before the end 2012 in order to enjoy the tax relief for Year 2012. Do take note that the tax relief for investing in PRS is only available for 10 years starting from Year 2012 to Year 2021.

How does this Tax Relief Works?
I'll try to make it easy to understand by making a case study of three individuals. 

Mr. A, Mr. B and Mr. C intends to invest into PRS for 2013. Mr. A decides to invest RM350/month into a PRS Fund, Mr. B only wants to invest RM250/month and Mr. C decides that RM100/month is what he can afford.

Total Amount Invested into PRS by Mr. A for Year 2013
: RM350/month x 12 months : RM4,200

Total Amount Invested into PRS by Mr. B for Year 2013
: RM100/month x 12 months : RM3,000


Total Amount Invested into PRS by Mr. C for Year 2013 
: RM100/month x 12 months : RM1,200


According to the Tax Relief incentive from investing in PRS, an individual whom invest in PRS is eligible for Tax Relief up to a maximum of RM3000. Therefore the eligibility of Tax Relief for Mr. A, Mr. B and Mr. C are:

PRS Tax Relief for Mr. A : RM3,000 (even though Mr. A has invested a total of RM4200 for 2013)
PRS Tax Relief for Mr. B : RM3,000
PRS Tax Relief for Mr. C : RM1,200

How much can I save from paying tax if I invest in PRS?
To illustrate this point, I need to use Mr. A, Mr. B and Mr. C again. The calculation will be divided into 3 sections. Section a) is to calculate tax to be paid without PRS tax relief, Section b) is the tax to be paid after PRS tax relief and Section c) is the savings.

a) Calculating Tax to be paid by Mr. A, Mr. B and Mr. C without PRS Tax Relief
Now we are going to assume that Mr. A, Mr. B and Mr. C have same total taxable amount* of RM78,000 at the end of 2013. (*Total taxable amount = Total income minus other reliefs such as EPF contribution, personal insurance, books, broadband, etc).

Next up is for us to refer to the Tax Schedule from LHDN (2011) as shown below:
Based on the Tax Schedule above, the amount of tax to be paid by Mr. A, B or C (not including PRS Tax Relief) is calculated as:

Total taxable amount for Mr. A, B and C is RM78,000/each person

1) Tax for first RM70,000 = RM7,125
2) Tax for the remaining RM8,000 (24% of RM8,000) = RM1,920

2013 Total Tax to be paid by Mr. A, B and C : RM7,125 + RM1,920 = RM9,045/each person

b) Calculating Tax to be paid by Mr. A, Mr. B and Mr. C after deducting PRS Tax Relief
Since Mr. A, B and C have invested in PRS, they are eligible for Tax Relief according to the amount they have invested. In this case both Mr. A and Mr. B will enjoy a relief of RM3,000 while Mr. C is only eligible for RM1,200 relief.

We can now calculate the total tax amount for Mr. A, B and C for 2013!

Total taxable amount for Mr. A and Mr. B : RM78,000 - RM3,000 = RM75,000/each person
Tax to be paid by Mr. A or Mr. B after deducting PRS Tax Relief 
1) Tax for first RM70,000 = RM7,125
2) Tax for the remaining RM5,000 (24% of RM5,000) = RM1,200

2013 Total Tax to be paid by Mr. A and Mr. B is : RM8,325/each person

Total taxable amount for Mr. C : RM78,000 - RM1,200 = RM76,800
Tax to be paid by Mr. C after deducting PRS Tax Relief
1) Tax for first RM70,000 = RM7,125
2) Tax for the remaining RM6,800 (24% of RM6,800) = RM1,632

2013 Total Tax to be paid by Mr. C is : RM8,757

c) Savings from PRS Tax Relief
Savings from paying tax for Mr. A and Mr. B : RM9,045 - RM8,325 = RM720
Savings from paying tax for Mr. C : RM9,045 - RM8,757 = RM288

I believe you can use the method above to calculate your own expected tax savings from investing in PRS. As a rough guideline, you can also refer to the table below to approximate how much you can save based on  your annual income range and that you qualify for the maximum value of RM3,000 PRS tax relief.

What can you do with that savings from the tax relief?
Let's take the case of Mr. B who have contributed RM 3,000 per annum into a PRS Fund. Savings of RM720 ringgit can be used by him to reimburse:

1. The sales charge fee of 3% 
2. The RM10 fee for opening of a PPA Account
3. The additional charges such as opening account fee with a PRS Provider

Well that's all for part 3 on the series of articles about PRS, I hope you've enjoyed reading the write-up on PRS.

If you like this article, do:
1. Share it on your Facebook!
2. Like my Facebook Page
3. Subscribe to me. See the "FOLLOW ME TO FINANCIAL FREEDOM" section located at the top left? Just key in your email and click Submit.

Cheers and Happy Investing!


Sunday, 13 January 2013

Private Retirement Scheme (PRS), What Is The Expected Performance? - Part 2

In Part 1 of the PRS series, I blogged about the basics of PRS and how it acts as an alternative retirement investment option. For Part 2, I'm taking four PRS funds offered by Hwang Management Sdn. Bhd. as a case study in an attempt to predict the performance of PRS funds. 

The four funds are:
1. Hwang PRS Growth Fund
2. Hwang PRS Moderate Fund
3. Hwang PRS Conservative Fund
4. Hwang AIIMAN PRS Shariah Growth Fund

Fund no.1 to no.3 are categorized under Core Fund while fund no.4 is categorized as Non-Core Fund. While many PRS Providers have launched their PRS Funds, I chose to look into PRS funds from Hwang Management Sdn. Bhd. due to the following reasonss:
1. Ease of obtaining the information for these funds.
2. Funds from Hwang Management Sdn. Bhd. have always perform better then the majority of their peers/competitors.

Now let's begin our review with:

What is the expected performance of Hwang PRS Growth & Moderate Funds? 
Both these funds are part of the trio of Core Funds. For Hwang's Growth and Moderate Funds, the investment target is at Asia countries excluding Japan. Growth Fund allocates at least 70% into equity while the remaining 30% into fixed income investments. Moderate Fund on the other hand allocates at least 60% into equity and remaining 40% into fixed income investments.

Simply said, the Growth fund is exposed to 70% equity related risk while the Moderate fund has 60% equity risk.

There are no equivalent funds from Hwang Investment which I can use as a reference to determine the expected performance of both Growth and Moderate funds. However I can summarize in general that funds investing into Asia excluding Japan have not been performing reasonably well for the past couple of years. Only for recently (2012) have funds from this category posted profitable returns as shown in the table below:
Without any track record, the performance of both PRS Growth Fund and PRS Moderate Fund are yet to be seen. However both funds are expected to produce returns equivalent or higher then EPF's 5.5% average annual returns

What is the expected performance of Hwang PRS Conservative Fund?
This fund is also part of the trio of Core Funds offered by Hwang Management Sdn. Bhd. The fund's main objective is preservation of capital. Therefore as stated in the prospectus, this fund would allocate a minimum of 80% of its Net Asset Value (NAV) into fixed income instruments such as bonds, private debts, securities, etc. 

Although I am quite doubtful that this fund is able to match EPF's 5.5% average annual returns, it is still too early to pass any judgement. I shall review the performance of this fund again in the future and I believe it might just pop a surprise or two.

What is the expected performance of Hwang AIIMAN PRS Shariah Growth Fund?
This is the only Non-Core PRS fund offered by Hwang Management Sdn. Bhd. Like the 3 Core funds discussed earlier, this fund also has no historical record of performance. Luckliy, we can still gauge the performance of this PRS fund by referring to existing Hwang AIIMAN Growth Fund (AGF).

Why refer to AGF?
Both funds are similar in terms :
1. Investment nature - Equity Malaysia
2. Risk profile - Will invest between 70% - 99% in Shariah compliant equities
3. Shariah Compliant - Both funds are Shariah compliant
4. Fund Manager - Both are managed by the same fund manager which is Mr. David Ng Kong Cheong.

In fact it is stated in the Hwang AIIMAN PRS prospectus that this fund will be "invested in a single collective investment scheme, namely the Hwang AIIMAN Growth Fund (AGF)".

Performance of AGF?
1. Cumulative Returns as of 31 Aug 2012


1 Year
(1 Sept 2011 – 31 Aug 2012)
3 Years
(1 Sept 2009 – 31 Aug 2012)
5 Years
(1 Sept 2007 – 31 Aug 2012)
Since Commencement (29 Oct 2012 – 31 Aug 2012)
Fund
22.14%
52.21%
64.08%
287.39%

2. Annual Averaged Returns as of 31 Aug 2012


1 Year
(1 Sept 2011 – 31 Aug 2012)
3 Years
(1 Sept 2009 – 31 Aug 2012)
5 Years
(1 Sept 2007 – 31 Aug 2012)
Since Commencement (29 Oct 2012 – 31 Aug 2012)
Fund
22.14%
15.02%
10.40%
14.74%


3. Actual Annual Performance by Year as of 31 Aug 2012


FY2012
(1 Sept 2011 – 31 Aug 2012)
FY2011
(1 Sept 2010 – 31 Aug 2011)
FY2010
(1 Sept 2009 – 31 Aug 2010)
FY2009
(1 Sept 2008 – 31 Aug 2009)
FY2008
(1 Sept 2007 – 31 Aug 2008)
Fund
22.14%
12.28%
10.99%
23.21%
-12.51%


The tables above clearly indicates that AGF is capable to generate an average of 10% or more per year. Word of caution that the fund has dropped -12.51% for Financial Year 2008 indicating that in future during an economy downturn, the fund could suffer another double digit loss. On the overall, AGF is still considered as one of the top 10 funds in the Malaysia Equity section.

With AGF as the reference point, I believe that the Hwang AIIMAN PRS Shariah Growth Fund performance should mirror that of AGF in the coming future.

Download Hwang Management Sdn Bhd's PRS Prospectus HERE

Summary
What was written above is based entirely on my own personal opinions and views. It is by no means a recommendation for you to buy or not to buy. All I ask is for oneself to do your own homework, research and reading before investing. The case studies above is just one of the many ways for you to predict the performance of PRS fund. While we can't predict the future, we can learn to expect all possibilities. Like what Benjamin Franklin once quoted; "An Investment In Knowledge Always Pays the Best Interest"!

In Part 3 of the PRS series, I intend to explain about the Tax Relief incentive offered to those investing in PRS.

If you like this article, please do the following:
1. Share it on your Facebook!
2. Like my Facebook Page
3. Subscribe to me. See the "FOLLOW ME TO FINANCIAL FREEDOM" section located at the top left? Just key in your email and click Submit.

Cheers and Happy Investing!