Saturday 25 January 2014

Investing into US Equity Market for 2014, YES or NO?

A few weeks ago, I've posted an article about diversifying your unit trust portfolio via lump sum investing. One of the investment area identified in the portfolio is the US Equity Market as shown below:


Why US Equity?
Many investors are predicting that the US stock market has reached the end of the bull market and that 2014 will usher in the era of the bear market. The poor performance of the Dow Jones over the past four trading days has seen the index fell  from 16458.56 points on Jan 17th to 16197.35 points on Jan 23rd, losing approximately 1.59% or 261.21 points.

Could this signify the start of a bear market for the US equity market? Are the charts and graphs telling investors that the worst is yet to come? 

Looking at the fundamentals of the US Economy
Charting and plotting graphs to predict the direction of the market was never my forte and shall remain so for the near future. Hence, when it comes to deciding whether the US Equity market is still worth investing in or not, I relied on these key fundamental economic points to decide:

Point 1 : US Purchasing Managers Index Chart above 50
As of 31 Dec 2013 the US Purchasing Manager Index stands at 57.00, which is way above the benchmark level of 50. Index value above 50 indicates that the US manufacturing sector is growing, which is good for the economy.


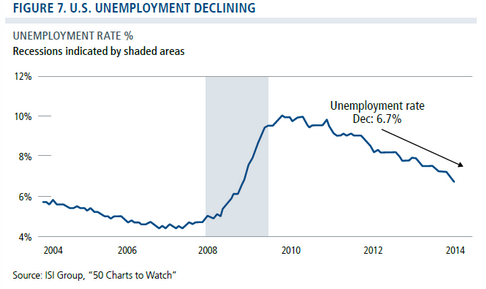
Point 2 : US Unemployment Rate is dropping
Fundamentally, continuous drop in  % of unemployment rate in a country signifies that the country's economy is growing and therefore creating more job opportunities.

As of 31st Dec 2013, the % unemployment rate in the United States stands at 6.7%. If you compare this with 7.9% a year ago, the reduction of % unemployment rate is certainly an indication of recovering economy. 

However, investors should be wary when the % unemployment rate hits 4.5%. Learn more about using % unemployment rate as a predictive tool by reading my post entitled "Predicting The Stock Market Trend, An Analysis Based on % Unemployment Rate".


Point 3 : US Treasury Yield Curve Rates remain positive
As of 22 Jan 2014, the US Treasury Yield Curve Rates are as shown below:


The rates above translates to a positive yield curve indicating that the US economy is still at growth stage. Learn more about Yield Curve by reading this post entitled "Using Yield Curve to Predict The Stock Market"

Point 4 : US Inflation Rate Remains Low at 1.5%
This point is taken from global economic outlook report by Calamos.com:

"What could derail this recovery? We believe the most significant threat to U.S. economic growth is inflation, which would cause long-term rates to spike. At this point, we believe the threat of this is low. Wage inflation is not a problem, as unemployment is still relatively high. At 1.5%, core inflation is well contained today and looks to be so for the foreseeable future, while the velocity of money, a primary driver of asset inflation, remains subdued"


Point 5 : The US Equity Market is currently in the Mid-Phase of A Bull Market
Based on the historical trend for bull and bear market, Calamos.com clearly illustrate that the current US Equity Market is in the mid-phase of a bull market. If the trending pattern is accurate, we might have about 150 weeks more of the bull market before the bear takes over as shown below:


Now that I've establish some reasonable economic points to support my reason of including the US Equity as part of my investment portfolio, the next question would be what sectors of the US Equity should one invest in for 2014?

Once again, I refer to Calamos.com's report on recommended sectors to invest in:
  • technology companies that are benefiting from secular shifts to mobile, the cloud, and internet and social media
  • consumer discretionary names tied to housing and autos
  • industrials benefiting from innovations in the U.S. energy sector (the "energy renaissance") and infrastructure spending
  • financials that may benefit from the upward slope in the yield curve, increased lending and stronger equity markets
If you have the facility that allows you to invest directly into US stocks, feel free to look into stocks of the above mentioned sectors. 

On the other hand, investors can also consider investing into unit trust funds that invests primarily in securities of United States of America companies. As a matter a fact, I found one UT fund that fits the above recommended sectors as shown below:


Apart from the fact that the fund's portfolio allocation contain the recommended sectors by Calamos, I am also confident confident that the fund would be able to generate reasonable returns on condition that the market is bullish. The 23.02% annualized return over a 2 year period by this fund certainly reaffirms my decision to invest into this fund.

That's all folks! Cheers and Happy Investing!

P/s : Like to find out what is the name of this fund? Feel free to inquire at sickfreak03@gmail.com

If you like reading this post, it would do me a great favor by:
1. Sharing this post on your Facebook!
2. Liking my Facebook Page

Sunday 19 January 2014

Top 10 Best Performing Unit Trust Funds As of 15th January 2014

If this is your first time reading this review, I would highly recommend that you read "A Guide Towards Understanding Unit Trust Performance Table" before proceeding.

Note : 
  1. This is the first performance review for 2014, therefore the Yield To Date (YTD) for 2 Weeks Gain/Loss Ranking Table has been set to start from the 1st of January 2014. 

Review
Fund Category : Equity Malaysia
a) Top 10 Best Performing Fund for Category Equity Malaysia (click Image to Enlarge):


5 Years Annualised Ranked 1 (Overall) 
Phillip Master Equity Growth Fund (+26.54% per annum)

5 Years Annualised Ranked 1 (Non-Islamic) 
- Phillip Master Equity Growth Fund (+26.54% per annum)

5 Years Annualised Ranked 1 (Islamic Equity) 
- MAAKL-HDBS Flexi Fund (+22.69% per annum)

b) 2 Weeks Gain/Loss Ranking Table for Category Equity Malaysia Funds:

Fund Name
YTD as of
1 Jan 2014
YTD as of
15th Jan 2014
2 Weeks
Gain / Loss (%)
2 Weeks Gain/
Loss Rankings
Previous
2 Weeks Gain/Loss Rankings
Phillip Master Equity Growth Fund
0
0.12
0.12
3
-
Kenanga Growth Fund
0
0.96
0.96
1
-
CIMB-Principal Wholesale Equity Fund
0
-0.68
-0.68
6
-
MAAKL-HDBS Flexi Fund
0
-0.69
-0.69
7
-
CIMB-Principal Equity Fund
0
-2.19
-2.19
10
-
Kenanga Syariah Growth Fund
0
-0.82
-0.82
8
-
RHB-OSK Dynamic Fund
0
0.11
0.11
4
-
Hwang AIIMAN Growth
0
0.21
0.21
2
-
CIMB-Principal Equity Fund 2
0
-1.87
-1.87
9
-
Public Islamic Opportunities Fund
0
-0.15
-0.15
5
-
AVERAGE 4 WEEKS GAIN/LOSS (%)
-0.50
Best Performing Fund over 2 weeks period: 
Non Syariah : Kenanga Growth Fund (+0.96%)
Syariah : Hwang AIIMAN Growth (+0.21%)

Worst Performing Fund 2 weeks period:
Non Syariah : CIMB-Principal Equity Fund (-2.19%)
Syariah : Kenanga Syariah Growth Fund (-0.82%)

c) Performance Comparison with the KLSE Index between 1 Jan 2014 to 15 Jan 2014


KLSE Index (%) Gain/Loss : -1.56%

Comparison With:
Average Top 10 Unit Trust Equity (%) Gain/Loss : -0.50% (Out performed the KLSE Index)
Non Syariah - Kenanga Growth Fund : +0.96% (Out performed the KLSE Index)
Syariah - Hwang AIIMAN Growth : +0.21% (Out performed the KLSE Index)


Review
Fund Category : Asia excluding Japan
a) Top 10 Best Performing Fund for Category Asia Exc Japan (click Image to Enlarge):


5 Years Annualised Ranked 1 (Overall) 
- Public Islamic Asia Dividend Fund (+14.00% per annum)

5 Years Annualised Ranked 1 (Non Islamic)
 - Pheim Asia Ex-Japan Fund (+10.95% per annum)

5 Years Annualised Ranked 1 (Islamic) 
- Public Islamic Asia Dividend Fund (+14.00% per annum)

b) 2 Weeks Gain/Loss Ranking Table for Category Asia Exc Japan Funds:

Fund Name
YTD as of
1 Jan 2014
YTD as of
15th Jan 2014
2 Weeks
Gain / Loss (%)
2 Weeks Gain/
Loss Rankings
Previous
2 Weeks Gain/Loss Rankings
Public Islamic Asia Dividend Fund
0
-2.33
-2.33
6
-
Pheim Asia Ex-Japan Islamic
0
0.65
0.65
1
-
Public Asia Ittikal Fund
0
-2.5
-2.5
9
-
PB Islamic Asia Equity Fund
0
-2.27
-2.27
4
-
Eastspring Investments Asia Pacific Shariah Equity Fund
0
-2.6
-2.6
10
-
Pheim Asia Ex-Japan
0
-1.35
-1.35
2
-
Eastspring Investments Asia Pacific Equity MY Fund
0
-2.3
-2.3
5
-
PB Islamic Asia Strategic Sector Fund
0
-2.43
-2.43
8
-
Public Regional Sector Fund
0
-1.89
-1.89
3
-
CIMB Islamic Asia Pacific Equity Fund
0
-2.41
-2.41
7
-
AVERAGE 4 WEEKS GAIN/LOSS (%)
-1.94

Best Performing Fund over 2 weeks period: 
Non Syariah : Pheim Asia Ex-Japan (-1.35%)
Syariah : Pheim Asia Ex-Japan Islamic (+0.65%)

Worst Performing Fund over 2 weeks period:
Non Syariah :  Eastspring Investments Asia Pacific Shariah Equity  Fund (-2.6%)
Syariah : Eastspring Investments Asia Pacific Equity MY Fund (-2.3%)

Performance Comparison with the MSCI Asia Excluding Japan Index between 1 Jan 2014 to 15 Jan 2014


MSCI Asia Exc Japan Index (%) Gain/Loss : -2.20%

Comparison With:
Average Top 10 Unit Trust (%) Gain.Loss : -1.94% (Out performed the MSCI Index)
Non Syariah - Pheim Asia Ex-Japan : -1.35% (Out performed the MSCI Index)
Syariah - Pheim Asia Ex-Japan Islamic : +0.65% (Out performed the MSCI Index)


Review
Fund Category : Greater China
Top 10 Best Performing Fund for Category Greater China (click Image to Enlarge):


5 Years Annualised Ranked 1 (Overall) 
CIMB Principal Greater China Equity Fund (+12.52% per annum)

5 Years Annualised Ranked 1 (Non Islamic)
CIMB Principal Greater China Equity Fund (+12.52% per annum)

5 Years Annualised Ranked 1 (Islamic) 
- Public China Ittikal Fund (+6.98% per annum)

2 Weeks Gain/Loss Ranking Table for Category Greater China Funds:

Fund Name
YTD as of
1 Jan 2014
YTD as of
15th Jan 2014
2 Weeks
Gain / Loss (%)
2 Weeks Gain/
Loss Rankings
Previous
2 Weeks Gain/Loss Rankings
CIMB-Principal Greater China Equity Fund
0
0.2
0.2
1
-
PB China Pacific Equity Fund
0
-2.44
-2.44
9
-
PB China Titans Fund
0
-1.68
-1.68
5
-
Public China Ittikal Fund
0
-2.14
-2.14
6
-
Public China Select Fund
0
-2.27
-2.27
7
-
MAAKL Greater China Fund
0
-1.02
-1.02
2
-
AmIslamic Greater China
0
-3.06
-3.06
10
-
Eastspring Investments Dinasti Equity Fund
0
-2.42
-2.42
8
-
Manulife Investment - China Value Fund
0
-1.39
-1.39
3
-
Pacific ELITE China Growth Fund
0
-1.5
-1.5
4
-
AVERAGE 4 WEEKS GAIN/LOSS (%)
-1.77

Best Performing Fund over 2 weeks period: 
Non Syariah : CIMB-Principal Greater China Equity (+0.20%)
Syariah : Public China Ittikal Fund (-2.14%)

Worst Performing Fund over 2 weeks period:
Non Syariah :  PB China Pacific Equity Fund (-2.44%)
Syariah : AmIslamic Greater China (-3.06%)

Performance Comparison with the Shanghai Stock Exchange (SSE) Index between 1 Jan 2014 to 15 Jan 2014


SSE Index (%) Gain/Loss : -4.08%

Comparison With:
Average Top 10 Unit Trust Equity (%) Gain.Loss : -1.77% (Out performed the SSE Index)
Non Syariah - CIMB-Principal Greater China Equity : +0.20% (Out performed the SSE Index)
Syariah - Public China Ittikal Fund : -2.14% (Out performed the SSE Index)

*******************
That's all for this review folks!


Cheers and Happy Investing!

Having difficulty understanding this review? Or perhaps you would like to start investing in Top Performing Funds such as Phillip Master Equity or CIMB-Principal Greater China? 

Then feel free to contact me at shanesee03@gmail.com for a proper advisory and recommendation.

Recommended Reads