Thursday, 4 June 2015

Top 10 Best Performing Unit Trust Funds As of 28th May 2015

Hi there readers!

Before you proceed, you might want to check out these pointers first: 
  • If you are new to unit trust investing, I'll be more then happy to share with you on how to get started with Unit Trust Investing without depending on others! Just drop me an email at shanesee03@gmail.com
  • If this is your first time reading this review, do check out "A Guide Towards Understanding Unit Trust Performance Table" before proceeding. This guide will help you understand the review better.
  • Lastly, save as much as 3% on Sales Charge when you invest into Unit Trust. Find out how to do it HERE.

Review

Fund Category : Equity Malaysia
a) Top 10 Best Performing Fund for Category Equity Malaysia 
(Ranked According to 5 Year Annualized Return):

Top 10 Unit Trust Fund - Equity Malaysia (5 Years) 

Top Performer based on 5 Year Performance

5 Years Annualised Ranked 1 (Non-Islamic) 
Kenanga Growth Fund (+21.83% per annum)

5 Years Annualised Ranked 1 (Islamic Equity) 
- Eastspring Investments Dana Al-Ilham (+16.61% per annum)

b) 4 Weeks Gain/Loss Ranking Table for Category Equity Malaysia Funds:

Fund Name
YTD as of
29th April 2015
YTD as of
28th May 2015
4 Weeks
Gain / Loss (%)
4 Weeks Gain/
Loss Rankings
Previous
4 Weeks Gain/Loss Rankings
Kenanga Growth Fund
13.85
13.63
-0.22
3
2
Eastspring Investments Dana Al-Ilham
8.48
6.31
-2.17
7
4
Kenanga Syariah Growth Fund
8.34
6.75
-1.59
6
5
Eastspring Investments Equity Income Fund
6.95
4.16
-2.79
8
6
PMB Shariah Aggressive Fund
22.23
22.05
-0.18
2
3
MAAKL-HDBS Flexi Fund
6.2
3.18
-3.02
9
5
RHB-OSK Smart Treasure Fund
17.52
19.55
2.03
1
N/A
AMB Dividend Trust Fund
5.28
4.5
-0.78
4
8
Areca Equity Trust Fund
8.68
7.63
-1.05
5
1
Affin Hwang AIIMAN Growth Fund
Returning
3.95
N/A
N/A
N/A
AVERAGE 4 WEEKS GAIN/LOSS (%)
-1.09

Best Performing Fund over 4 weeks period: 
  • Non Syariah : RHB-OSK Smart Treasure Fund (Gain : +2.03%)
  • Syariah : PMB Shariah Aggressive Fund (Loss : -0.18%)

Worst Performing Fund 4 weeks period:
  • Non Syariah : Eastspring Investments Equity Income (Loss : -2.79%)
  • Syariah : MAAKL-HDBS Flexi Fund (Loss : -0.18%)

c) Performance Comparison with the KLSE Index between 29 April 2015 to 28 May 2015


KLSE Index (29 April 2015 - 28 May 2015)

KLSE Index (%) Gain/Loss :  (Loss : -5.22%)

Comparison With:
Average Top 10 Unit Trust Equity (%) Gain/Loss: 
(Loss : -1.09% Out performed the KLSE Index)

Non Syariah Best Performing Fund: 
RHB-OSK Smart Treasure Fund (Gain : +2.03% Out performed the KLSE Index)

Syariah Best Performing Fund: 
PMB Shariah Aggressive Fund (Loss : -1.09% Out performed the KLSE Index)

d) Top 10 Best Performing Fund for Category Equity Malaysia
(Ranked According to Yield To Date):


Top 10 Unit Trust Fund - Equity Malaysia (Yield To Date)

Top Performer based on Yield To Date (YTD) Performance

YTD Ranked 1 (Non-Islamic) 
RHB-OSK Smart Treasure Fund (YTD : +19.55%)

YTD Annualised Ranked 1 (Islamic Equity) 
- PMB Shariah Aggressive Fund (YTD : +22.05%)


Review

Fund Category : Asia excluding Japan
a) Top 10 Best Performing Fund for Category Asia Exc Japan 
(Ranked According to 5 Year Annualized Return):

Top 10 Unit Trust Fund - Asia exc Japan (5 Years)

Top Performer based on 5 Year Performance

5 Years Annualised Ranked 1 (Non-Islamic) 
Eastspring Investments Asia Pacific Equity MY Fund (+8.20% per annum)

5 Years Annualised Ranked 1 (Islamic Equity) 
- Public Islamic Asia Dividend Fund (+9.67% per annum)

b) 4 Weeks Gain/Loss Ranking Table for Category Asia Exc Japan Funds:


Fund Name
YTD as of
29th April 2015
YTD as of
28th May 2015
4 Weeks
Gain / Loss (%)
4 Weeks Gain/
Loss Rankings
Previous
4 Weeks Gain/Loss Rankings
Public Islamic Asia Dividend Fund
10.75
7.95
-2.8
9
4
Public Asia Ittikal Fund
12.72
10.02
-2.7
8
3
Eastspring Investments Asia Pacific Equity MY Fund
11.79
9.97
-1.82
5
2
PB Islamic Asia Equity Fund
11.63
9.12
-2.51
7
7
TA Asian Dividend Income Fund
9.17
10.9
1.73
1
5
Pheim Asia Ex-Japan Islamic
7.55
6.71
-0.84
4
8
Affin Hwang Select Asia (Ex Japan) Opportunity Fund
12.08
12.84
0.76
2
N/A
PB Islamic Asia Strategic Sector Fund
11.27
9.35
-1.92
6
6
Eastspring Investments Asia Pacific Shariah Equity MY Fund
New
14.2
N/A
N/A
N/A
MAAKL Pacific Fund
17.2
16.7
-0.5
3
N/A
AVERAGE 8 WEEKS GAIN/LOSS (%)
-1.18
Best Performing Fund over 4 weeks period: 
  • Non Syariah : TA Asian Dividend Income Fund (Gain : +1.73%)
  • Syariah : Pheim Asia Ex-Japan Islamic Fund (Loss : -0.84%)
Worst Performing Fund over 4 weeks period:
  • Non Syariah : Eastspring Investments Asia Pacific Equity MY Fund (Loss : -1.82%)
  • Syariah : Public Islamic Asia Dividend Fund (Loss : -2.80%)

c) Performance Comparison with the MSCI Asia Excluding Japan Index between 29 April 2015 to 28 May 2015

MSCI Asia Exc Japan Index (29 April 2015 - 28 May 2015)

MSCI Asia Exc Japan Index (%) Gain/Loss : -3.64%

Comparison With:
Average Top 10 Unit Trust (%) Gain/Loss: 
(Loss : -1.18% Out performed the MSCI Index)

Non Syariah Best Performing Fund:
TA Asian Dividend Income Fund (Gain : +1.73%  Out performed the MSCI Index)

Syariah Best Performing Fund:
Pheim Asia Ex-Japan Islamic Fund (Loss : -0.84% Out performed the MSCI Index)


d) Top 10 Best Performing Fund for Category Asia Exc Japan
(Ranked According to Yield To Date):

Top 10 Unit Trust Fund - Asia Exc Japan (Yield To Date)

Top Performer based on Yield To Date (YTD) Performance

YTD Ranked 1 (Non-Islamic) 
MAAKL Pacific Fund (YTD : +16.7%)

YTD Annualised Ranked 1 (Islamic Equity) 
- PB Asia Emerging Growth Fund (YTD : +15.32%)


Review

Fund Category : Greater China
Top 10 Best Performing Fund for Category Greater China 
(Ranked According to 5 Year Annualized Return):

Top 10 Unit Trust Fund - Greater China (5 Years)

Top Performer based on 5 Year Performance

5 Years Annualised Ranked 1 (Non-Islamic) 
CIMB-Principal Greater China Equity Fund (+11.87% per annum)

5 Years Annualised Ranked 1 (Islamic Equity) 
- Eastspring Investments Dinasti Equity Fund (+8.79% per annum)

b) 4 Weeks Gain/Loss Ranking Table for Category Greater China Funds:


Fund Name
YTD as of
29th April 2015
YTD as of
28th May 2015
4 Weeks
Gain / Loss (%)
4 Weeks Gain/
Loss Rankings
Previous
4 Weeks Gain/Loss Rankings
CIMB-Principal Greater China Equity Fund
21.54
24.53
2.99
1
4
Manulife Investment - China Value Fund
26.16
26.9
0.74
3
1
Pacific Focus China Fund
18.88
19.36
0.48
4
6
PB China Pacific Equity Fund
21.83
21.34
-0.49
9
3
Eastspring Investments Dinasti Equity Fund
18.08
17.92
-0.16
7
8
Public China Select Fund
20.93
21.26
0.33
5
5
PB China Titans Fund
18.97
18.59
-0.38
8
7
MAAKL Greater China Fund
23.37
25.18
1.81
2
2
Public China Ittikal Fund
14.24
12.03
-2.21
10
9
AmIslamic Greater China
11.3
11.17
-0.13
6
10
AVERAGE 4 WEEKS GAIN/LOSS (%)
0.30
Best Performing Fund over 4 weeks period: 
  • Non Syariah : CIMB-Principal Greater China Equity Fund (Gain : +2.99%)
  • Syariah : AmIslamic Greater China Fund (Loss : -0.13%)
Worst Performing Fund over 4 weeks period:
  • Non Syariah : Public China Ittikal Fund (Loss : -0.16%)
  • Syariah : Eastspring Investments Dinasti Equity Fund (Loss : -0.16%)
c) Performance Comparison with the Shanghai Stock Exchange (SSE) Index between 29 April 2015 to 28 May 2015

SSE Index (29 April 2015 - 28 May 2015)

SSE Index (%) Gain/Loss : +11.20%

Comparison With:
Average Top 10 Unit Trust Equity (%) Gain/Loss : 
(Gain : +0.30% - Under performed the SSE Index)

Non Syariah Best Performing Fund:
CIMB-Principal Greater China Equity Fund (Gain : +2.99% - Under performed the SSE Index)

Syariah Best Performing Fund:
AmIslamic Greater China Fund : (Loss : -0.13% - Under performed the SSE Index)

d) Top 10 Best Performing Fund for Category Greater China
(Ranked According to Yield To Date):


Top Performer based on Yield To Date (YTD) Performance

YTD Ranked 1 (Non-Islamic) 
Manulife Investment China Value Fund (YTD : +26.9%)

YTD Annualised Ranked 1 (Islamic Equity) 
- Eastspring Investments Dinasti Equity Fund (YTD : +17.92%)

*******************
How did you find this report? 
Was it beneficial to you? 
What additional information would you like to see on this report?

Email me your feedback at shanesee03@gmail.com 
and I'll send over a FREE ebook as a token of appreciation!

Oh by the way, don't forget to take advantage of the ongoing Sales Charge Promotion!
Some of the top 10 funds such as Kenanga Growth Fund, Kenanga Syariah Growth Fund, Eastspring Dana Al-Ilham, PMB Shariah Aggresive Fund and many more are available for as low as 0% Sales Charge! Promotion ends 18 June 2015, so hurry up!
Check out all the details HERE! 

Cheers and Happy Investing!

Thursday, 28 May 2015

The Secret Behind EPF's 2014 Outstanding Dividend of 6.75%

Ever wondered how Employees Provident Fund (EPF) was able to declare a dividend of 6.75% in 2014? As a matter of fact, this was the highest ever dividend declared since year 2000! The last we notice a dividend higher then this was in 1999 where 6.80% was declared thanks to the recovery of the local stock market from the 1998 Asian Financial Crisis.

The amazing thing about EPF is their ability to consistently generate dividend regardless of the stock market sentiment. Take a look at this comparison between EPF return vs KLCI return between 1986 to 2008:

Data from i3investor
As you can see, regardless of the ups and downs of the KLCI, EPF has consistently generate positive returns. Clearly such consistency from a fund with billions under its management is unrivaled anywhere else.

6.75% dividend despite a falling KLSE Index in 2014?
Now if we take a look at KLSE index performance in 2014, we see that the index ended 91.7 points or 4.95% lower:

2nd January 2014 - 1852.95 points
31 December 2014 - 1761.25 points
Difference : -91.7 points
With the index shedding 4.95% in 2014, how is it still possible for EPF which have large holdings in numerous local blue chips and growth companies able to generate a positive return? 

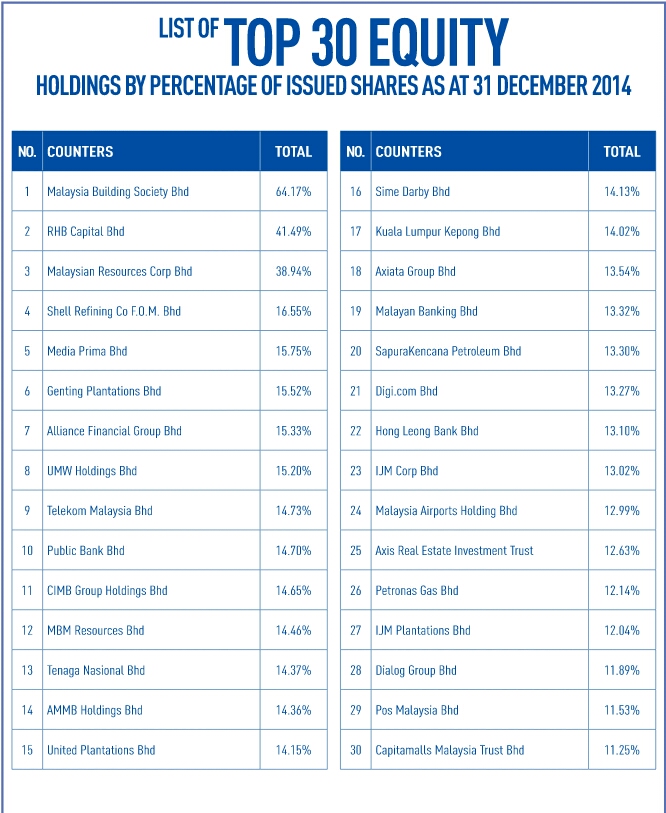
EPF's top 30 local equity holdings as of 31st  Dec 2014:

How EPF did it!
To answer the above question, let us first take a look at EPF's asset allocation in 2014:

EPF 2014 Asset Allocation

Obviously as a retirement fund, EPF has to allocate a large portion of their asset (51%) towards Fixed Income. The second largest allocation is invested into Equity asset class at 36%.

10% is allocated to "Inflation asset" where in actual fact it is made of 6% in real estates and 4% in infrastructure and natural resources. The remaining 3% is in the form of cash and money market.

Equities Asset Class leading the way!
The table below indicates how each Asset Class performed in 2014:


The total ROI of Investment for all Asset Class is 7.25%.

The highlight among all asset classes is the ROI of Equities asset class which generated returns of 11.29%. The question is how did EPF manage to generate a double digit return in Equity class despite a negative performing KLSE Index?

The answer actually lies in EPF's foreign investment asset allocation and strategy. 

EPF's foreign investment asset allocation and strategy!
Let's take a look at some key statistics of EPF's foreign investment data:

Statistic 1 : 23% of EPF's Asset is allocated into Foreign Investment.


In other words, out of the total managed asset of RM636.53 billion, approximately RM145.29 billion is allocated by EPF into foreign investments.

Statistic 2 : 18% of EPF's Total Managed Asset is invested into Foreign Equities
The breakdown of 23% as stated in Statistics 1:

  • 18% is invested into foreign Equity
  • 3% in Bonds
  • 2% in real asset and private equity


Statistic 3 : By 2016, EPF targets 26% to be allocated into Foreign Investment

EPF Foreign Investment Asset Allocation Strategy

Statistic 4 : Foreign Investment contributed RM13.01 billion in Gross Income
In 2014, EPF achieved total gross income (keuntungan) of RM39.08 billion. Out of the total gross income of RM39.08 billion, RM13.01 (or 33%) is contributed by Foreign Investment.

EPF 2014 Gross Income Breakdown
By investing only 23% of its total asset into foreign investment, EPF was able to generate returns that make up 33% of the total gross income.

If we calculate the percentage (%) return upon invested asset we get the following numbers:

Total Foreign Investment = RM145.29 billion
Total Foreign Gross Income = RM13.01 billion

Percentage (%) Return from Foreign Investment
= (RM13.01 billion / RM145.29 billion ) x 100%
8.95%

As for domestic investment, the percentage (%) returns is shown below:

Total Domestic Investment = RM 491.24 billion
Total Domestic Gross Income = RM26.07 billion

Percentage (%) Return from Domestic Investment
= (RM26.07 billion / RM491.24 billion ) x 100%
5.31%

Statistic 5 : 18% of Total EPF Gross Income is contributed by Foreign Listed Equity
Referring back to the diagram in Statistic 4, we can see that Foreign Listed Equity is the biggest contributor of EPF's foreign income.

Now that we know the reason behind EPF's outstanding dividend declaration of 6.75% is contributed by foreign investment (specifically foreign listed equity), how would you like to find out where is EPF actually investing in? The next point will shed some light.

Find out EPF's Top 3 Foreign Investment by Markets!
EPF is investing into two main markets consisting of:

  • Develop Markets
  • Asia/Emerging Markets/ex-Japan
For Develop Markets, the top 3 countries are:
  1. United States (15.7% of Total Foreign Investment)
  2. United Kingdom (9.4% of Total Foreign Investment)
  3. Australia (4.5% of Total Foreign Investment)
As for Asia/Emerging Markets/ex-Japan Markets, the top 3 consist of:
  1. Singapore (9.4% of Total Foreign Investment)
  2. China (5.9% of Total Foreign Investment)
  3. Thailand (5.6% of Total Foreign Investment)
As a matter of fact, investment in the above 6 countries make up 50.5% of EPF's total foreign investment.

What is the reason for EPF's aggressive expansion in foreign investment?
To answer this question, I'm taking an excerpt from an announcement made by EPF Chief Executive Officer Datuk Shahril Ridza Ridzuan:

“It is also worth mentioning that EPF’s global investments this quarter had contributed 44 per cent to our total income. The strengthening of the US dollar against major currencies had enhanced returns from our global investments and further demonstrates the benefits of our diversification strategy in the light of weak domestic equity markets.”

It is clear that EPF is struggling to obtain decent returns from the domestic stock market. As a matter of fact, EPF's Equity income for Quarter 1, 2015 is largely contributed by gains from emerging and developed market as indicated in the excerpt below:

"During the quarter under review, Equities which made up 43 per cent of the Fund’s total investment assets emerged as the top investment income contributor of RM6.36 billion, representing 59.87 per cent of total income. The income generated was 31.44 per cent higher compared with RM4.84 billion recorded in the same corresponding period in 2014. The increase was mainly due to the higher income recognised in EPF’s global portfolios, capitalising on a price rally in both emerging and developed markets during the quarter."
As investor, what should you do?
Now that we know that the reason behind EPF outstanding dividend declaration is due to aggressive expansion in foreign investment, shouldn't we consider diversifying our investment into foreign market as well? Is it wise to continue investing into local stocks or unit trust that invest only in Malaysia Equities?

Perhaps some serious consideration should be given towards diversifying your investment portfolio into overseas equities like what EPF is also doing?

So you've decided to diversify into overseas equities. What are the options available?
There are a few options that you can choose when it comes to investing in overseas equities.

  • For stock investment, you can consider opening a foreign stock trading account (which is available via local banks or via an international online trading account). To be honest I'm not familiar with foreign stock trading account which makes it difficult for me to provide more information in terms of selecting a good trading account, what are the fees incurred as well as the charges per transaction. If you're interested to explore further into foreign stock trading account, you can try searching the internet for more information.
  • On the other hand, you can also consider investing through unit trust funds that specializes into overseas investment. To get an idea on how unit trust funds are performing in markets such as China and Asia Pacific Excluding Japan, you can check out my Top 10 Best Performing Unit Trust Funds Review. Speaking of investing overseas via unit trust fund, there is an ongoing campaign by Eunittrust that offers investors an opportunity to invest into selected overseas funds for as low 0% sales charge . You can check out further information about the campaign HERE

I hope this post has helped you get a better understanding of EPF's investment approach and how this organization has continue to perform beyond expectation. This post also serves as a wake up call for us investors to not just invest into local equities. Instead we should broaden our horizon and explore the possibility of investing elsewhere.

Cheers and Happy Investing!

P.S. : If you like this post, please do share it via Facebook. Don't forget as well to give our Invest Made Easy Facebook page a big LIKE

P.P.S : Invest Made Easy wants to give you a FREE ticket to the Biggest Investment Conference in Malaysia! Click HERE for details on how to claim your FREE ticket!

P.P.P.S : Disclaimers:

  • All data and statistics are taken from EPF's 2014 Annual Report. 
  • Excerpts are taken from EPF's news announcement. 
  • Opinions expressed are purely of my own only.

Monday, 25 May 2015

Attend The Biggest Investment Conference In Malaysia Absolutely FREE!

Good news for Invest Made Easy readers! 

Invest Made Easy in a collaboration with PhillipCapital Malaysia is offering you an opportunity to attend one of the biggest annual investment conference in Malaysia absolutely FREE!

Which conference is this?
This is PhillipCapital's 6th Annual Investment Conference!


When, Where and What Time?


List of Speakers?


Participating Fund Houses?


What benefits will you get from attending this conference?
This Annual Conference brings you more than 10 distinguished speakers to share insightful and up-to date topics ranging from the global economy, investment strategies to investors' sentiments. Conference Highlights include:
  • Renowned investment and fund management experts both local and from abroad
  • Panel discussion on strategies for the second half of 2015
  • Concurrent sessions on a wide range of topics ranging from equity and derivatives to investment approaches to cater to participants' diverse interest
  • Focal point for investment and wealth management insights
  • Excellent opportunity for networking and personal interaction with industry professionals and service providers

Never been to a conference of this scale before?
Check out the pictures from the 4th and 5th Conference to get an idea of how big of an event the upcomming conference will be:

2013 - 4th Investment Conference:
Phillip Capital 4th Annual Investment Conference 2013, A Raging Success!

2014 - 5th Investment Conference:

The crowd
Full house
CIOs and Fund Managers 

Now you can attend the 6th Investment Conference for FREE too!
Thanks to a special collaboration between Invest Made Easy (IME) with PhillipCapital Malaysia, we are giving our readers an opportunity to attend this conference absolutely FREE! In order to get your FREE conference ticket you only need to fulfill one simple condition.

What condition is that?
All you need to do is to sign up a FREE account with eUnittrust via this link below:


Never heard of eUnittrust before? Find out all about this awesome Unit Trust Investing Platform HERE

When will I get the FREE ticket after signing up with eUnittrust?
Once you've completed the sign up and obtained an account ID with eUnittrust, the conference ticket will be sent to you automatically via email.

If you did not receive you conference ticket within 7 days of receiving your eUnittrust account ID, just drop me an email at shanesee03@gmail.com. I'll personally follow up your case with the eUnittrust team.

What is the purpose of this collaboration?
This collaboration between IME with PhillipCapital Malaysia is intended to empower investors through education and to equip them with the right tool to manage their own investment. From this collaboration, we hope to achieve the following outcomes:
  1. We want you to have a better understanding about unit trust investing!
  2. We want you to be in control of your investment by giving you an online tool (eUnittrust) that allows you to choose from a wide range of funds to invest in as well as save on sales charge!
  3. We want to empower you with knowledge through expert views shared during this conference!
The best thing about this joint collaboration is that we are giving you all following benefits at zero cost:
  1. FREE ticket to attend one of the biggest investment conference in Malaysia. 
  2. FREE investment knowledge from top fund managers in the country
  3. FREE investment outlook and strategy to apply for your unit trust investment.
  4. FREE eUnittrust account with no obligation to invest, no yearly charges, no maintenance fees and no hidden fees.

Am I being paid to post this?
Nope, I am NOT being paid by PhillipCapital Malaysia to promote this event. Neither am I earning any commission from ticket sales. I'm doing this as part of Invest Made Easy's mission to educate and empower the Malaysian community.

Got questions?
Email me at shanesee03@gmail.com

Happy investing and most importantly, what are you waiting for? FREE seat are limited!